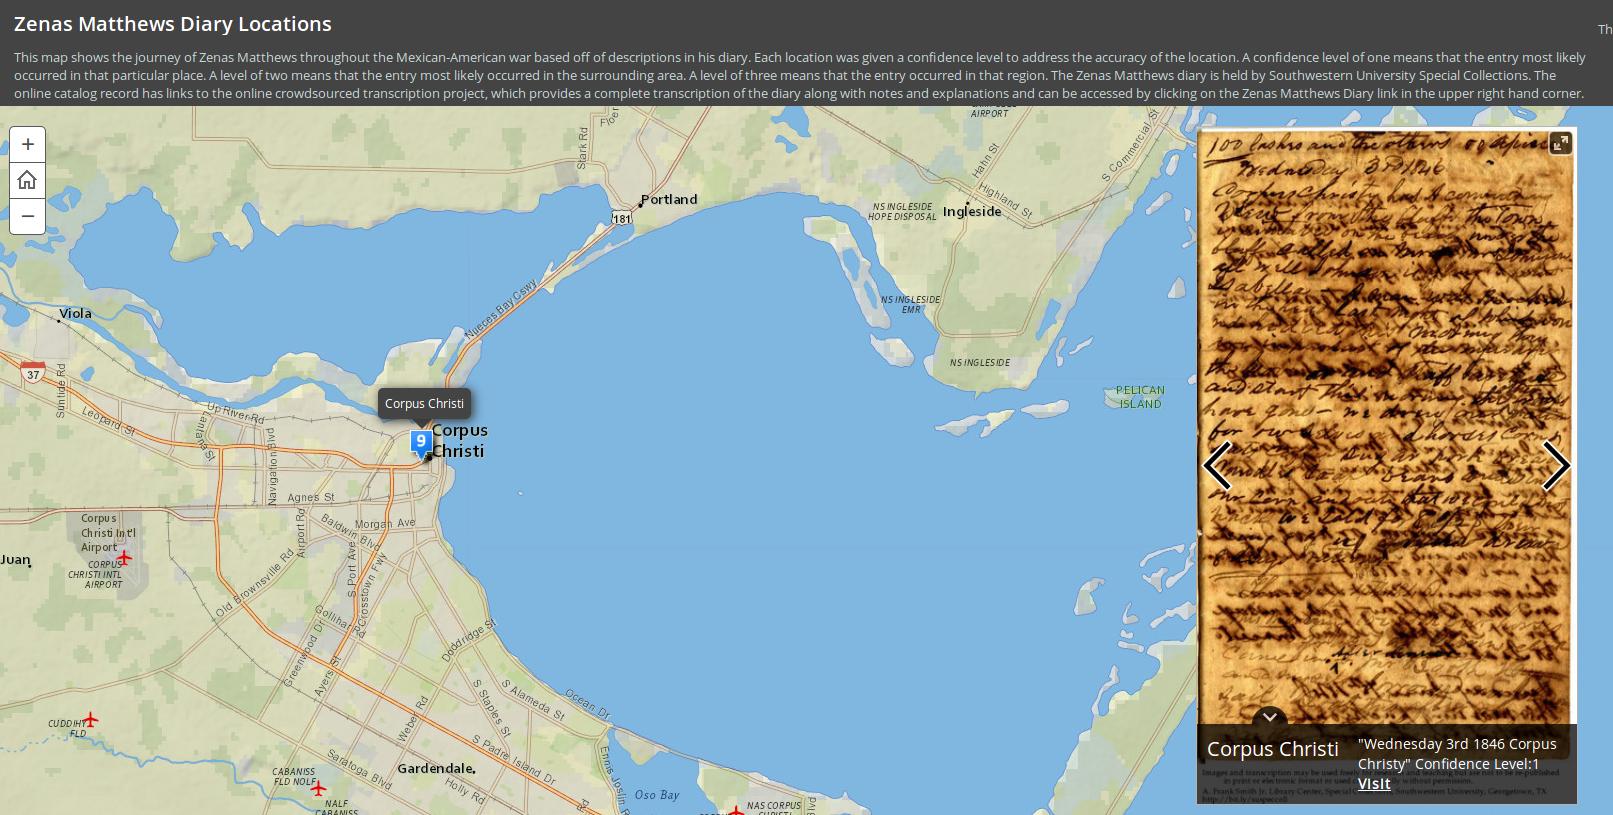
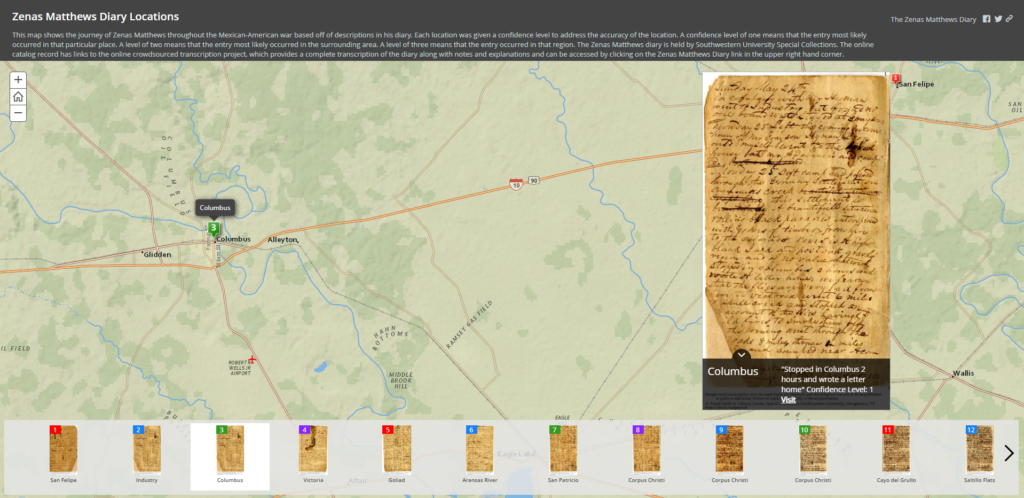
Megan Firestone, the head of special collections at the Smith Library Center at Southwestern University, shared this map based on the diary of Zenas Matthews, transcribed by a volunteer. Each location on the map shows a page from Matthews' diary that was written in the area. This data visualization was created using ArcGIS StoryMaps.


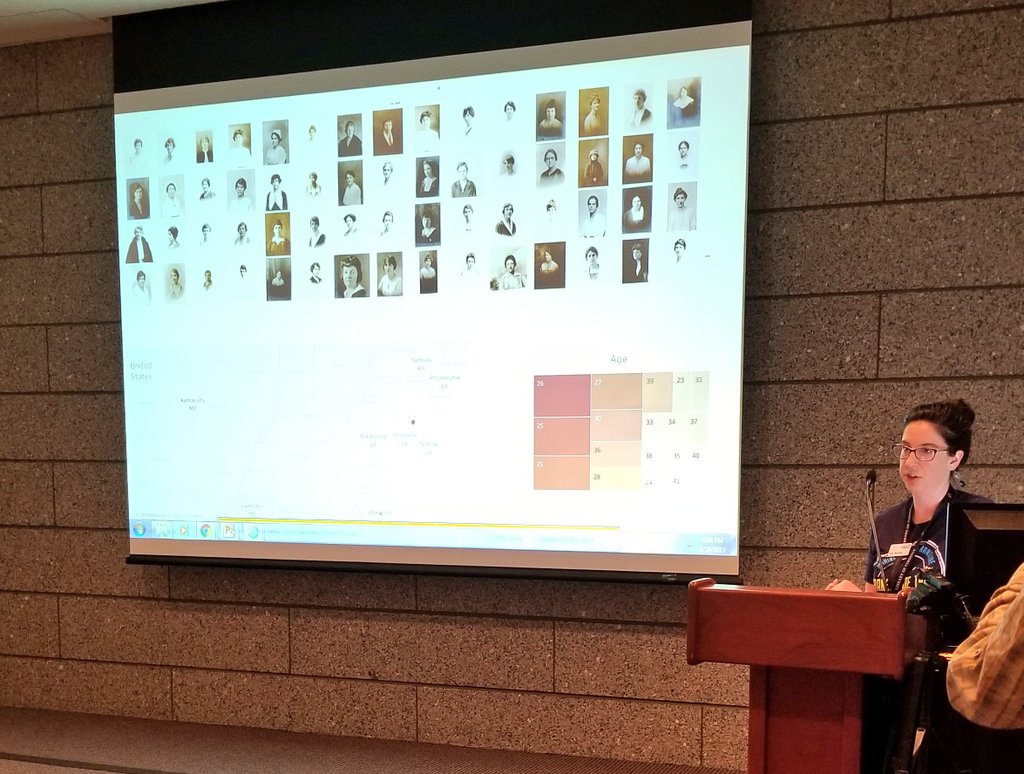
Jessi Bennett from the Library of Virginia demonstrated this collection of nurse portraits which was indexed on FromThePage with name, age, and location. This data visualization was created using Tableau.

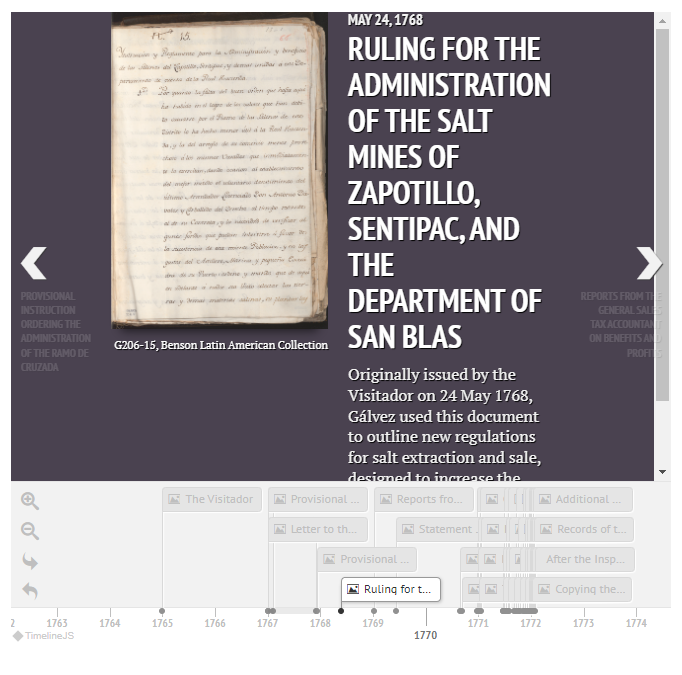
The University of Texas at Austin used transcribed texts on FromThePage to create this timeline of colonial Mexico history.

