 Friday I attended the Texas AI Summit, a one day AI-focused conference conveniently in my hometown. The fun of a conference like this is looking for techniques and tools that could be applied to Digital Humanities projects; the pain is sitting through so many eye bleeding talks with mathematical formulas for classifying data. Here are the two best ideas. You're welcome.
1) Use Narratives instead of Spreadsheets or Visualizations.
Kristian Hammon of Northwestern U. Computer Science, also CTO of Narrative Science, talked about generating narratives based on data. He considers spreadsheets abominations.
Writing narratives to explain just the important things from data sets seems like the sort of thing historians already do, and writing interpretive narrative structures for many different ways to slice-and-dice a dataset seems an extension of that skill.
Hammond's example application is taking data from SalesForce, which many companies use to track sales cycles and sales people, and instead of showing a dashboard ("an insult on top of an abomination"), generating an understandable narrative. (I'm making the following up based on what I remember.) For example, "Karen has closed $5000 in business this month, which is above average for her team. She has consistently ranked in the top 20% of performers across the company this year. There is not enough data to predict her pipeline."
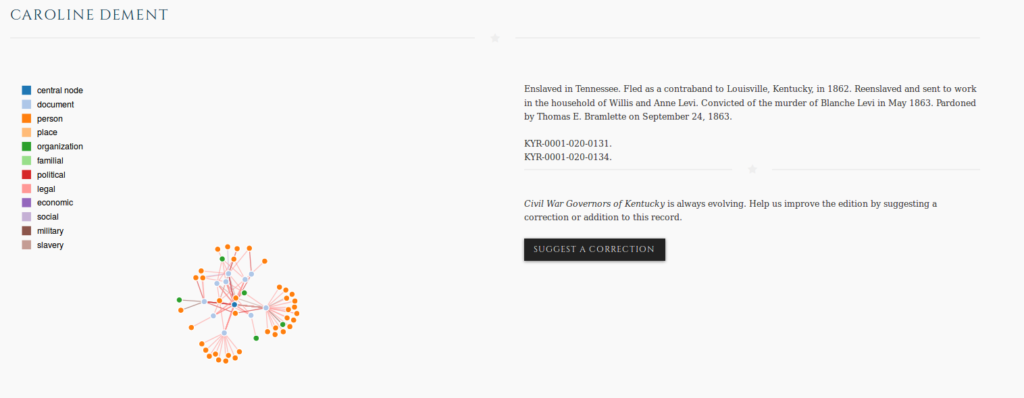
I was thinking how this could be applicable to the work we did for the Civil War Governors of Kentucky Digital Documentary Edition. Patrick Lewis's (the editor) favorite story to tell is about Caroline. Here's our page with a biography, network graph of relationships, and links to documents about Caroline:
But what if we could computationally generate a narrative like "Caroline is notable in CWGK because she is a woman when only X% of people mentioned are women and is African American when only Y% of the people in CWGK are African American. She's an outlier because she had relationships we've categorized as slavery relationships and as legal relationships, which is an unusual combination indicating an enslaved person interacting with the legal system."
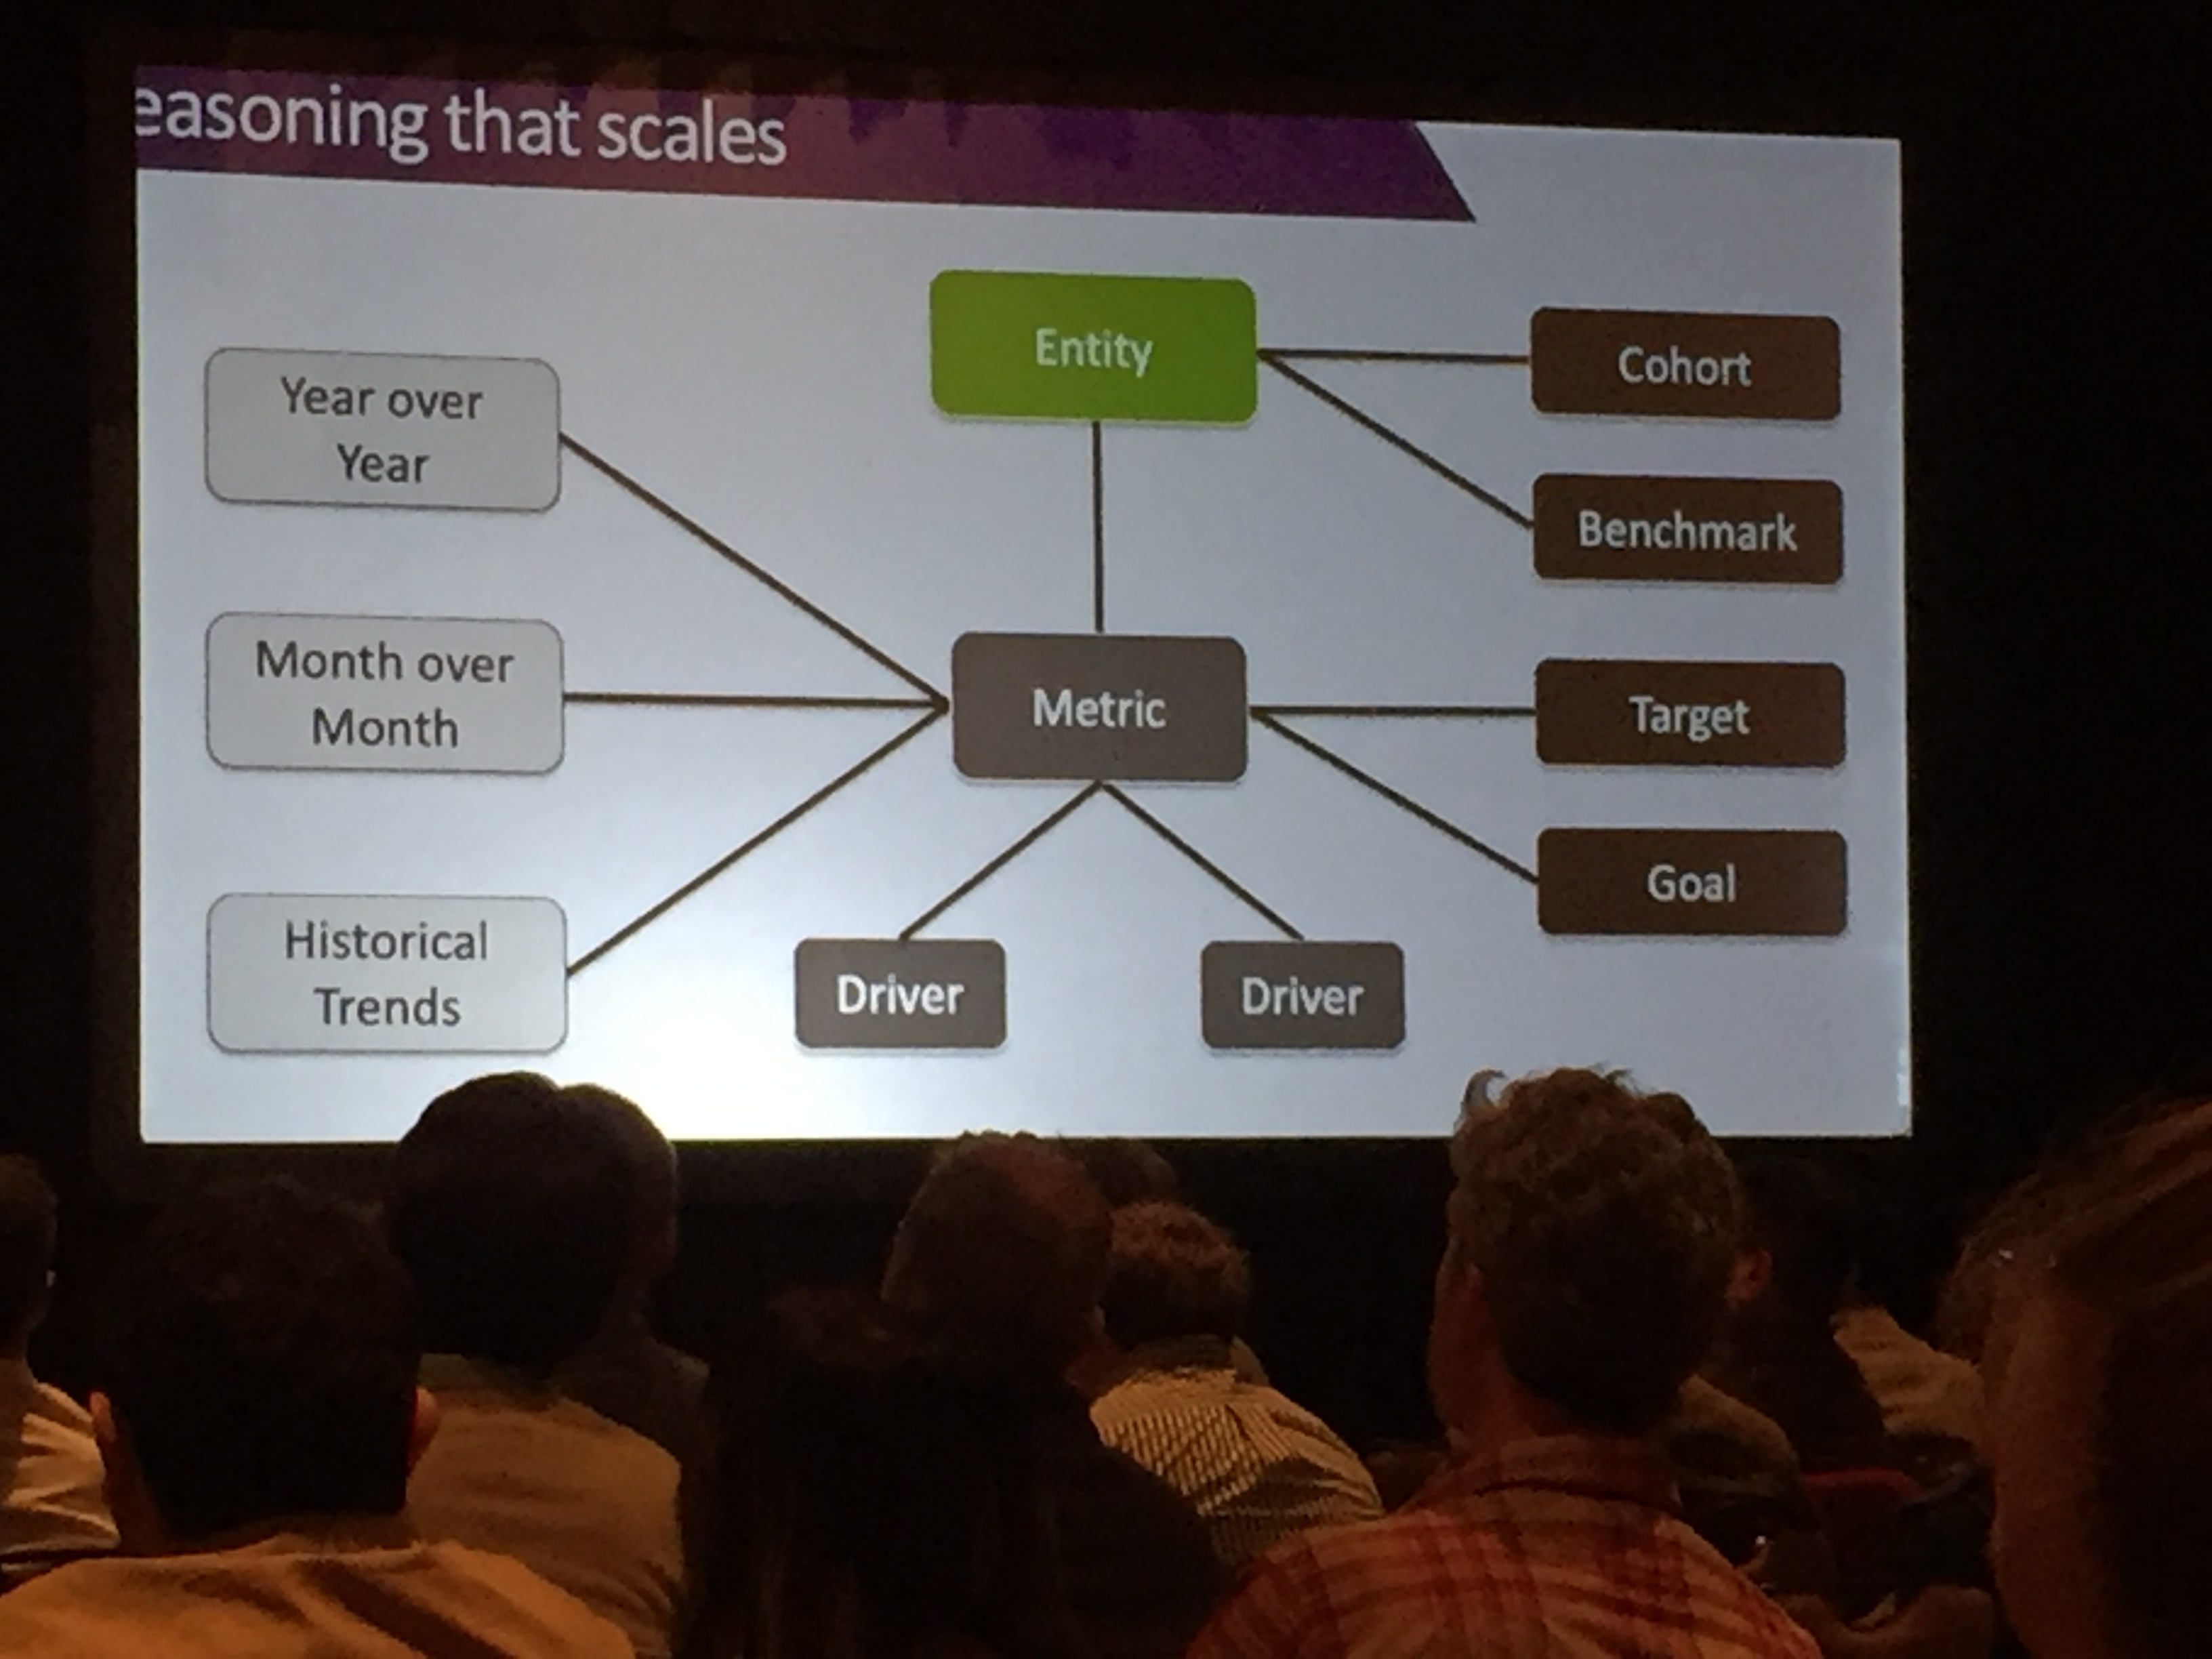 The key here is that the narrative would be machine generated -- that somehow we could identify the unique data or the comparative data or the trends and surface them in *words* rather than data or visualizations. The basic approach is to identify your "entities", the "metrics", and the drivers of those metrics. If you can add in cohorts and benchmarks to entities; timeframes, targets and goals to metrics you can start seeing how you can group and compare data with stock narrative phrases. To take our CWGK example, entities would be the people, places, events we identified. Cohorts would be grouping by the fields we collected in biographies, like gender, race, and date ranges. The business world measures targets and goals; what are the proxies for historical data? A target is an external thing you're measuring against i.e. "how many calories did this person consume? Was their literary output above or below the average?" Salesforce uses data to compare Karen to her peers in the same timeslice; would it be useful to compare a historical Karen on a timeline? For instance, "Here's how she was doing in 1865 compared to how she was doing in 1890?"
When I think about projects like MSU's Enslaved (Brumfield Labs is working with two of the Enslaved partners), which is creating linked open data sets of people, places, and events in the historic slave trade, I don't worry how we're going to create the data, but instead how to make that data usable by historians. SPARQL is not an easy query language to learn and the visual query builders are still rudimentry. Generating narratives might help us make data more accessible and useful.
2) Using Convolutional Neural Networks to classify text
Convolutional Neural Networks are used to classify things and answer questions i.e. "is this a cat picture" or "does this image contain ships." CNNs are complicated to understand, but if you think "model" and don't worry about how the model is built (you should worry, but not while brainstorming how to use CNNs), they are a useful tool. The following text centered use case was one that I thought had potential for the humanities.
Weifeng Zhong used an archive of six decades of the People's Daily -- the official newspaper of the Communist Party of China -- to predict when a policy change was coming.
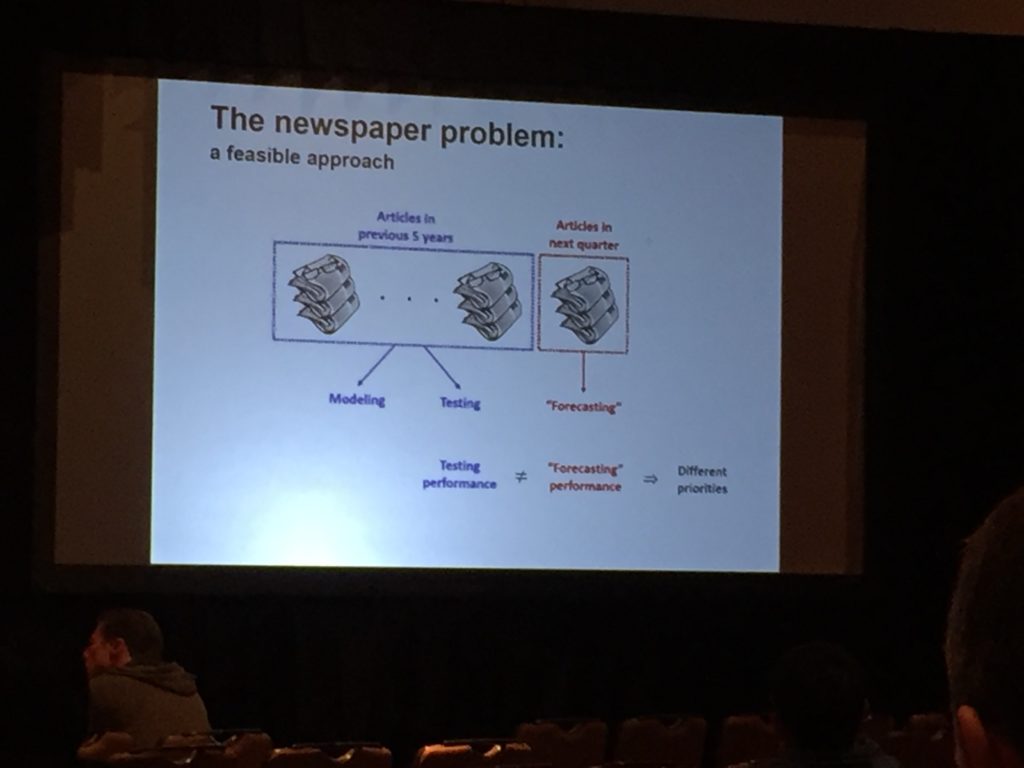 They used the page number of articles in the propaganda (Zhong's word) newspaper as a proxy for priority of related policy. This can be used for predicting change, since propaganda proceeds policy changes. They trained their model on 5 years of article data, using the title and first 100 words as the content and "on page 1" or "not on page 1" to indicate priority. They then used that model to classify the "next" quarter's article data. If the model predicts that an article won't appear on page 1, but it actually does, that indicates a policy change may be coming. You flag the articles that were miscategorized -- either appearing on the first page when the model didn't expect them to, or not appearing on the first page when the model expected them to -- and a human analyst reads the articles the model classified wrong to figure out *what* policy may be changing. The policy change factor -- a measure of the policy change -- is the difference between the predicted page numbers (aka priority) and actual page numbers. The more articles that were misclassified, the bigger policy change is coming. (They actually did this for every rolling 5 year window, to identify quarter by quarter policy change measures, which they graphed over time.)
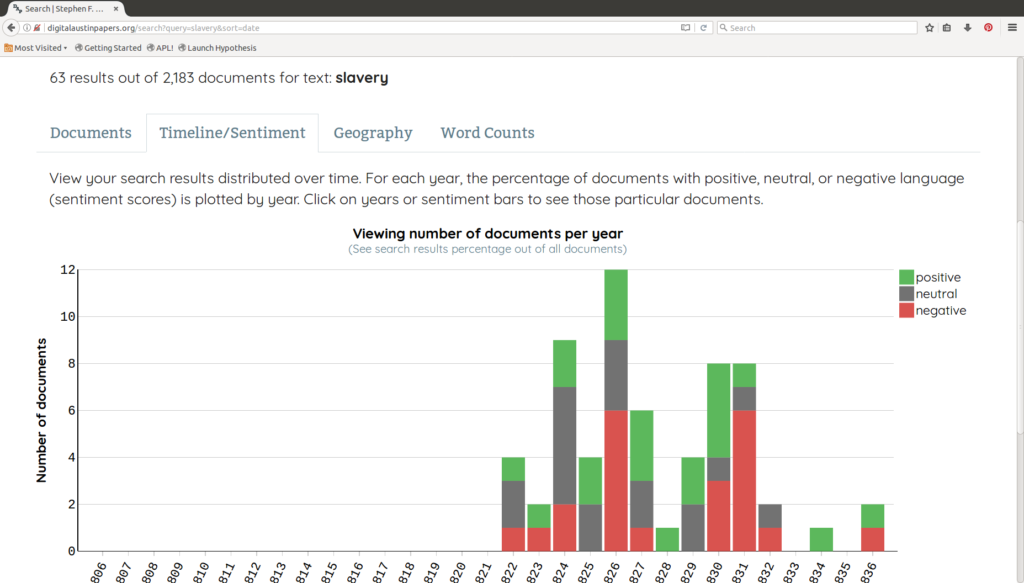
This is a clever way to think about changes in text. Misclassified articles are the important ones to read to understand why/how policy is changing -- the exceptions. I could see this general approach being used as a way to examine intellectual history or political opinion changes -- look for places where what people are saying precedes policy changes. The hard part is determining what someone decided was high priority -- in this case, the page number determines that. What else could be used to determine that? Headlines? Amount of words related to a subject (say, in letters)? We've done similar work looking for opinion changes in letters in the Digital Austin Papers using sentiment analysis to identify when the sentiments around a topic change -- the best example is slavery:
But this required knowing the topic first, then looking for changes over time. The CNN approach doesn't require you to know what the policy change is; you just identify that one happened and then dig in and understand what changed.
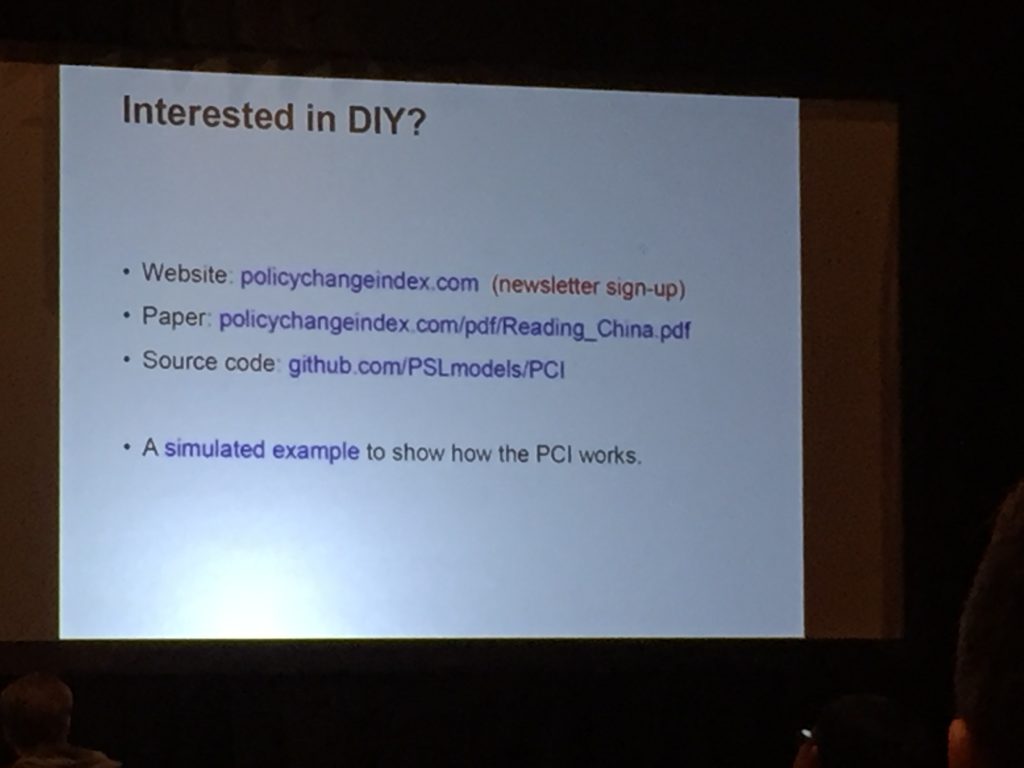
All their software is open source on github.
Have your own AI-driven digital humanities project? Need some technical collaborators? Schedule a meeting with us or drop me a line (saracarl@gmail.com).

