

With the introduction of the advanced editor in FromThePage, we’ve given project owners the option to add editorial tagging buttons to projects. One tag we’re particularly excited about is the DATE tag: the DATE button wraps a snippet of text like this:
<date when=”YYYY-MM-DD”>Last Thursday</date>
And the transcriber or editor enters the date as the tag suggests -- YYYY-MM-DD -- a format known as the Extended Date Time Format or EDTF.
As historians and researchers, you should love EDTF because it allows for uncertainty in your dates. If you only know what century or season is being referenced, that’s fine.
As technologists, we love EDTF because it works with dates in ALL of the documents in FromThePage -- from 1960s civil rights papers to 16th century natural history manuscripts -- in the same way.
So, what might we do with tagged dates in documents?
Visualizations, specifically timelines, are the first thing that comes to mind.
We could provide a way to browse pages based on the dates mentioned, so you could see the spread of pages over time and expand a page to read from the timeline. And this is just the simplest idea out of many.
Ben was recently reading Benjamin Schmidt’s “Modeling Time” essay in The Shape of Data in Digital Humanities which reminded us that time is not just a line -- it’s cyclical.
Year after year, season after season, things repeat. In our own work we see this in the visualization Github provides of contributions by a particular developer:
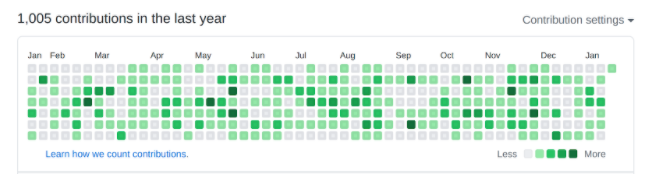
The graph stacks the 365 days of the year over each other with a column for each week and a row for each day of the week, and use color intensity to show the number additions for each day.
Looking across the X-axis of the graph, you can see that last January and September had relatively little activity, as did the run-up to Christmas. But since the Y-axis represents weekdays, you can also see that Sundays, Tuesdays, and Saturdays show less activity than other days of the week.
This got us thinking about visualizing the cyclical nature of time as a circle -- or a spiral!
The great visualization example site Blocks yielded possibilities like Tom Shanley’s spiral heatmap :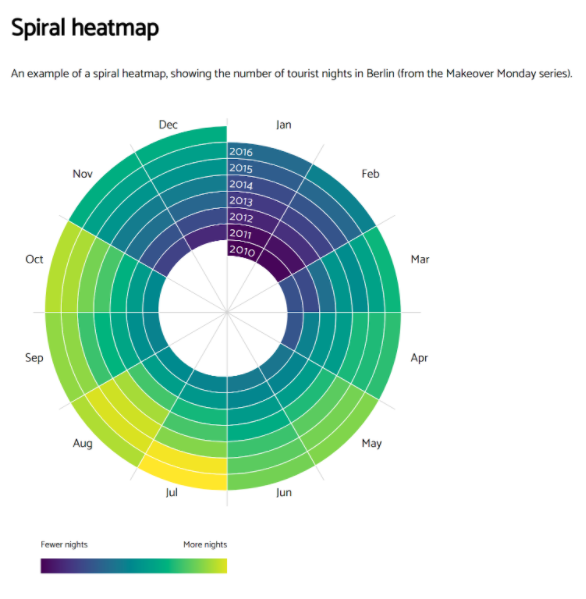
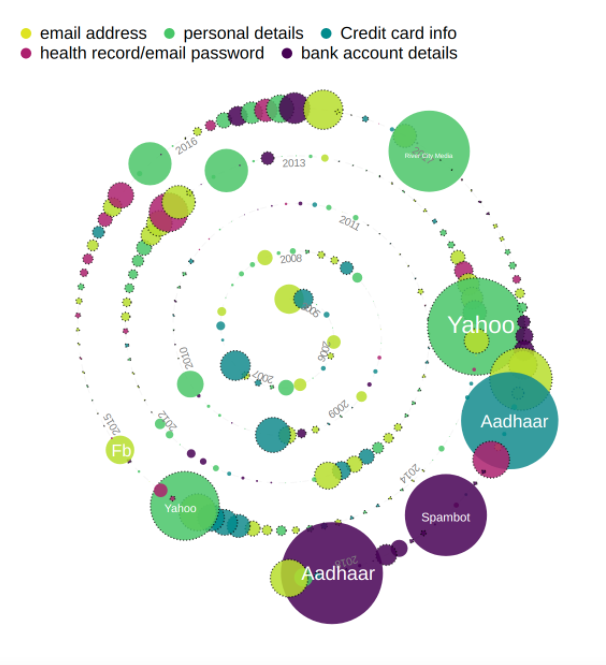
And Hannah Yan Han’s Spiral Circles:
We should be able to mine the subjects within a textual collection to find out what date the subject was mentioned on, then visualize those subjects to indicate seasonality of anything from bird observations to farming activities, military movements, or subjects of sermons.
While we don’t have immediate plans to build this into FromThePage, “to everything there is a season” and date tags get us one step closer.
If you’d like to brainstorm about time, timelines, the possibilities of tagging or exporting tagged text from FromThePage to build your own visualizations, we’d love to talk. Feel free to schedule a call with us.
- Ben & Sara